


Antares: Update on Sales Projections for Xyosted (ATRS, $3.30, Buy)
Investment Thesis
I have seen seven plus months of data on prescription trends for Xyosted as estimated by the prescription auditing service Symphony. My confidence is strong that Xyosted is experiencing a very solid launch and is on its way to becoming a major success. I have developed a model that uses the Symphony data as a base to build a model to project future sales. The purpose of this report is to show the assumptions that drive this model.
Unfortunately, my Xyosted sales model is flawed. Actual sales in 1Q, 2019 and 2Q, 2019 were $771,000 and $4,623,000 which compares to my estimates of $671,000 and 2,532,000. The principal reason for this underestimate appears to be that Symphony’s pharmacy sample is underestimating the number of new (NRx) and refilled (RRx) prescriptions. So the principal base on which I am building my model is not that good in an absolute sense. However, I think that it is a good indicator of magnitude and momentum and you should not look at any of my estimates as being more than that. That said, here are some key projections from my model.
- 2019 full year sales of $18.8 million,
- 4Q, 2019 sales of $7.9 million which annualizes to $31.6 million,
- 2020 full year sales of $53.9 million.
Again I urge you to look at magnitude and trend rather than accepting these numbers as being carved in stone. If the actual 2020 sales are anywhere close to my $53 million estimate, say $40 million, I think that Xyosted would be a very significant contributor to profits and of course, I would look for dramatic growth in sales and profit contribution beyond 2020.
Street consensus estimates are that peak sales (roughly five to seven years out from launch) will reach $200 million. I would take the over on this. This report is exclusively focused on Xyosted, which is the principal driver of my Buy on Antares. However, the combined potential of the AB rated versions of EpiPen and Forteo, Makena subcu, the sumatriptan generic and a burgeoning pipeline probably justifies buying Antares without taking Xyosted into consideration. For more discussion on the non Xyosted components of Antares see my August 8 report.
Discussion of Recent Prescription Trends
The stock action of Antares has shown a noticeable correlation to prescription trends for Xyosted, which have had some erratic ups and downs on a weekly basis although the trend continues very strong. Just look at the fluctuations in weekly prescriptions from July 6 to August 17 as shown in the next table. It is my hypothesis that NRxs for Xyosted should be weaker in July and August due to patient and doctor vacations. Xyosted does not address an acute disease needing immediate medical attention. If this is correct, we could see an improved trend for Rx growth in September and beyond.

If you take a simple average over this period comprising July 6 through August 17, the average weekly increase in NRx was 22 and the average weekly increase in RRx was 24. If we look at a longer time period from February until August 17, the average weekly increase in NRx was virtually the same at 21 as was the average increase in refilled RXs at 24. This strongly supports the statement that the trends are strong. In my model going forward though the balance of 2019 and throughout 2020 (Shown in the appendix), I am estimating that the average weekly increase in NRxs will be 18 and the weekly increase in RRxs will be 21. This is just to be conservative and not to signal that I am predicting a slowdown. In fact, I could easily argue for an acceleration as physicians gain more experience and as the prescriber base grows. But for now…………………..
How My Xyosted Sales Model IS Built
I track weekly prescription trends as reported by Symphony. As just explained, in making projections I estimate that the average increase in NRx will be 18 and the average increase in RRx wlll be 21. The list or WAC price is $475 per Rx. During the 2Q conference call, management suggested that the net price is a little greater than 50% of the WAC price or $238+. Going forward, I am using $250 as the price realized per each prescription. In 1Q, my model underestimated sales by 15% and in 2Q it underestimated sales by 83%. I told you it was flawed. Let me reiterate the assumptions underlying my sales model for the balance of 2019 and all of 2020.
- The average increase in weekly NRx is 18.
- The average increase in weekly RRx is 21.
- 30% of NRx in the remainder of 2019 are not reimbursed and in 2020 this drops to 20%.
- The average price of an NRx and RRx is $250.
- Because my model has underestimated sales by 15% in 1Q, 2019 and 83% in 2Q, I am using an adjustment in which I increase sales as shown by model by 15% to arrive ay sales projection. This 15% is just an outright, unsubstantiated guess but I think some adjustment is necessary.
A summary of my resultant sales projections for the last two quarters of 2019 and all quarters in 2020 are as follows:

Let’s look at 3Q, 2019 to illustrate the adjustment that I am making to my model. Using the assumptions on NRx and RRx trends and the pricing assumptions, my model projects $4,790,825 of sales. I then adjust this up by 15% to try to account for the understatement in prescriptions in the Symphony audit. This adjustment is pure guesswork. My model understated sales by 15% in 1Q, 2019 and 83% in 2Q, 2019. I am using an upward adjustment of 15% for 3Q, 2019, 4Q, 2019 and each quarter of 2020.
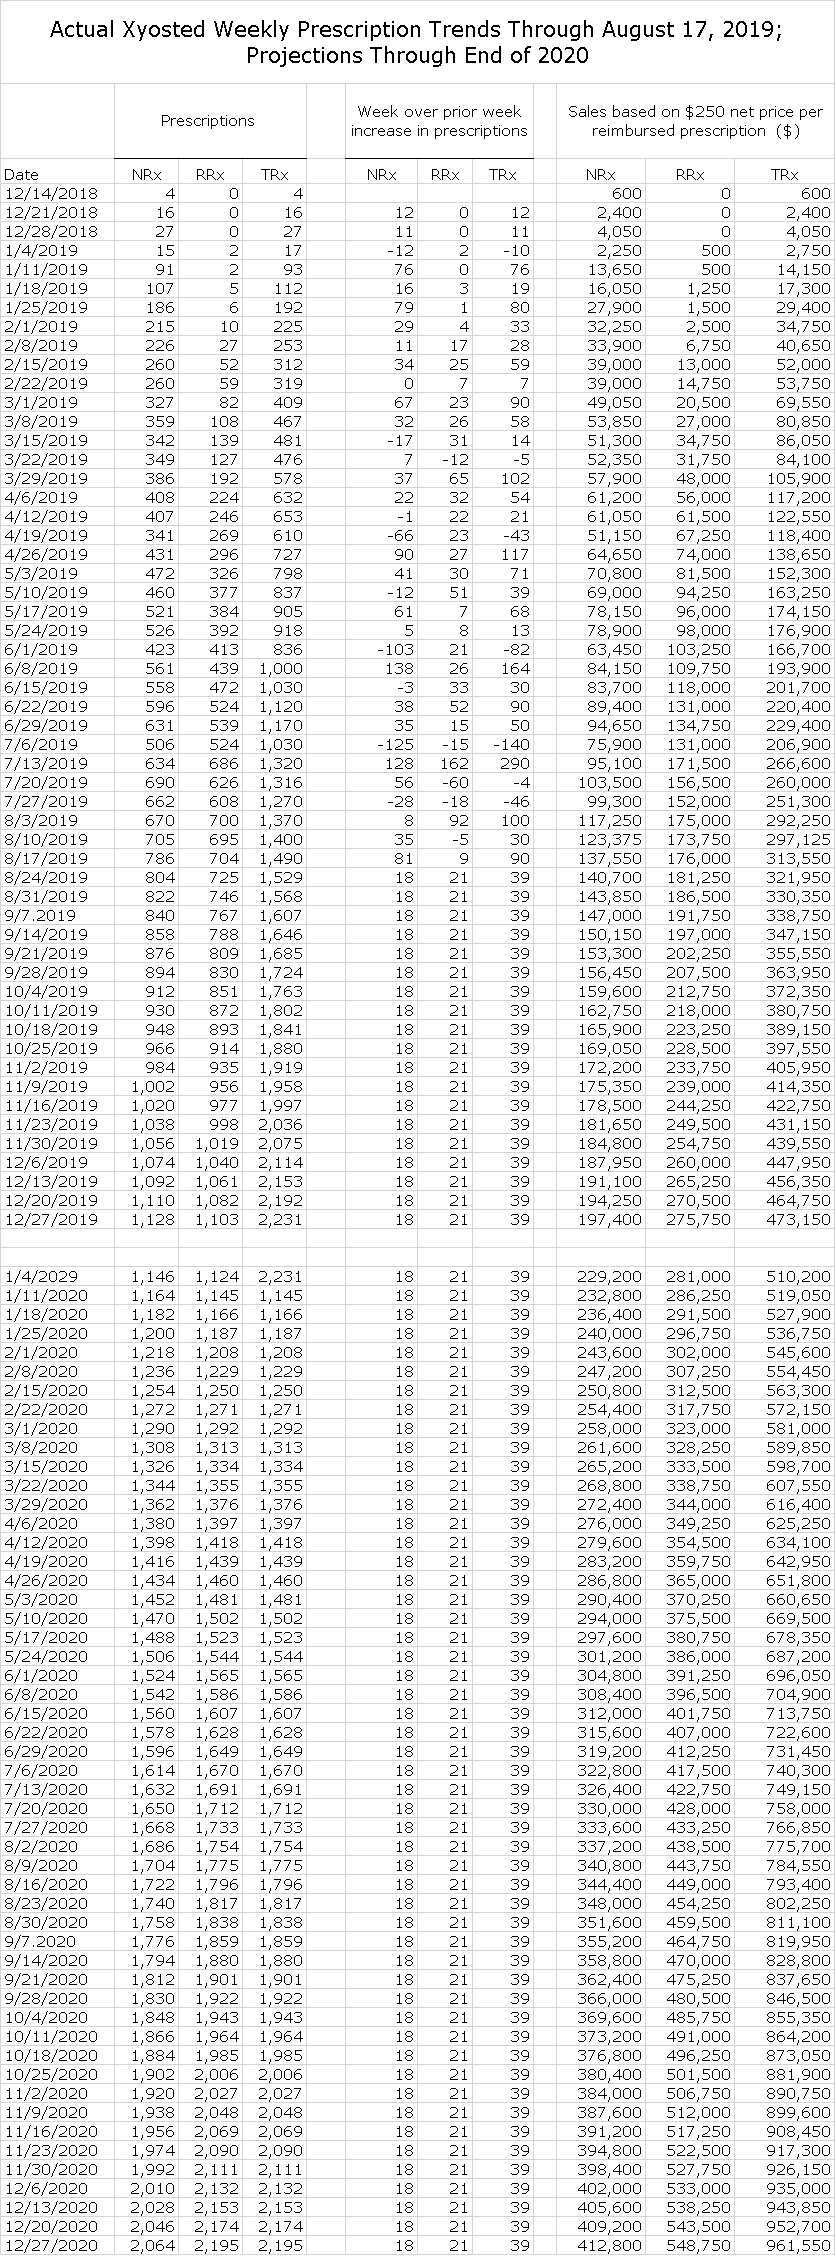
APPENDIX
Here are detailed weekly projections.
Tagged as Antares Pharma Inc., Xyosted sales projections + Categorized as Company Reports, LinkedIn, Smith On Stocks Blog
as usual the selloff resumes right after the article. Unreal